Implementation of Moving Averages with TA-Lib
TA-Lib serves as an essential instrument for financial market analysis, assisting in the computation of various indicators. For an introduction to TA-Lib, please refer to [TA-Lib] #1 Exploring the Essentials of Technical Analysis and TA-Lib, and for installation instructions, consult [TA-Lib] #2: Installing TA-Lib for Technical Analysis. Guidance on how to retrieve price data using yahooquery can be found at [Python] Yahooquery: Retrieving and Managing Past Stock and Financial Data.
Calculation of Moving Averages and Code Sample
from yahooquery import Ticker
import talib
import pandas as pd

# Retrieve Google stock data
google = Ticker("GOOG")
price_data = google.history(period="2y")
close_prices = price_data['close'].values

# Compute Simple Moving Average
sma = talib.SMA(close_prices, timeperiod=20)

# Compute Exponential Moving Average
ema = talib.EMA(close_prices, timeperiod=20)

# Compute Weighted Moving Average
wma = talib.WMA(close_prices, timeperiod=20)

# Display Results
result = pd.DataFrame({
    'Close Prices': close_prices,
    'SMA': sma,
    'EMA': ema,
    'WMA': wma
})
print(result.tail())
     Close Prices         SMA         EMA         WMA
498    130.149994  127.218999  127.709403  128.844237
499    130.210007  127.487999  127.947556  129.129094
500    130.169998  127.711499  128.159217  129.384523
501    131.830002  128.049999  128.508816  129.776761
502    130.270004  128.359499  128.676548  129.988190
Market Trend Analysis Using TA-Lib
Utilizing moving averages enables the analysis of the overall trend of the market.
last_5_sma = sma[-5:]

# Ascending Trend Confirmation
if all(last_5_sma[i] < last_5_sma[i + 1] for i in range(4)):
    print("The market is in an upward trend.")
# Descending Trend Confirmation
elif all(last_5_sma[i] > last_5_sma[i + 1] for i in range(4)):
    print("The market is in a downward trend.")
else:
    print("The market is stable.")
In this example, the market trend over the last 5 days is analyzed using moving averages. The trend is classified as ascending if the moving averages increase consecutively, and descending if they decrease.
sma5 = talib.SMA(close_prices, timeperiod=5)
sma20 = talib.SMA(close_prices, timeperiod=20)
sma60 = talib.SMA(close_prices, timeperiod=60)

# Assumption: Short-term, Mid-term, Long-term moving averages for the last 5 days
short_ma_last_5 = sma5[-5:]
mid_ma_last_5 = sma20[-5:]
long_ma_last_5 = sma60[-5:]

# Confirmation of Each Moving Average Rising Consecutively
is_short_ma_rising = all(x < y for x, y in zip(short_ma_last_5, short_ma_last_5[1:]))
is_mid_ma_rising = all(x < y for x, y in zip(mid_ma_last_5, mid_ma_last_5[1:]))
is_long_ma_rising = all(x < y for x, y in zip(long_ma_last_5, long_ma_last_5[1:]))

# Trend Analysis
if is_short_ma_rising and is_mid_ma_rising and is_long_ma_rising:
    print("Strong upward trend")
elif is_short_ma_rising:
    print("Short-term upward trend")
elif is_long_ma_rising:
    print("Long-term upward trend")
else:
    print("The trend is ambiguous")
This example compares the short-term, mid-term, and long-term moving averages for the last 5 days to analyze the market trend.
- By confirming whether each moving average is consecutively rising, an upward trend is identified. If short-term, mid-term, and long-term moving averages are all rising, it is considered a strong upward trend; if only the short-term is rising, it is a short-term upward trend; if only the long-term is rising, it is a long-term upward trend.
- In the case of a downward trend, a trend is determined if each moving average is consecutively declining. Depending on which of the short-term, mid-term, long-term moving averages is declining, the trend can be further categorized.
- If the trend is unclear, i.e., only some of the short-term, mid-term, long-term moving averages are rising or declining, further analysis may be required.
This method offers the advantage of understanding the overall market situation by considering the changes in each moving average, and precisely analyzing and segmenting the rising and falling trends. Different periods and moving average indicators can be used for more refined analysis, allowing for flexible application in investment strategies.
Analysis of Golden Cross and Dead Cross Using TA-Lib
Golden Cross
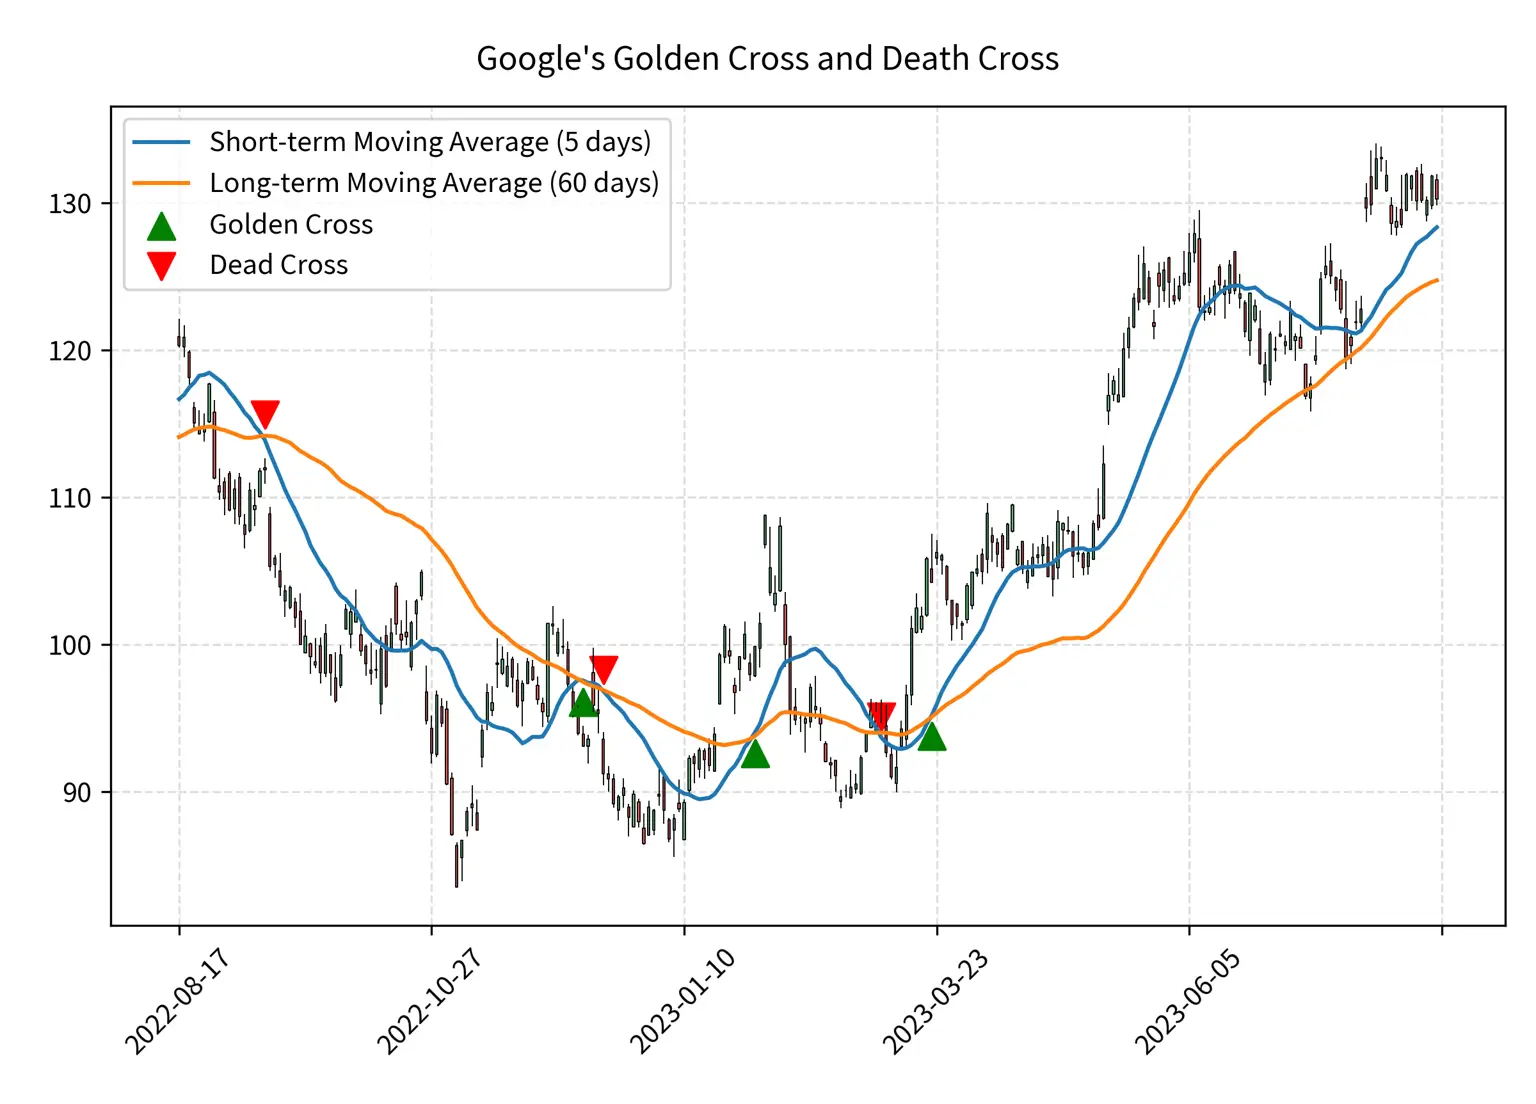
A golden cross occurs when the short-term moving average breaks above the long-term moving average. The following code demonstrates how to find a golden cross.
short_sma = talib.SMA(close_prices, timeperiod=20)
long_sma = talib.SMA(close_prices, timeperiod=60)

# Finding a golden cross
for i in range(1, len(close_prices)):
    if short_sma[i] > long_sma[i] and short_sma[i-1] <= long_sma[i-1]:
        print(f"Golden cross identified: day {i}")
Dead Cross
A dead cross occurs when the short-term moving average breaks below the long-term moving average. The following code is an example of how to find a dead cross.
# Finding a dead cross
for i in range(1, len(close_prices)):
    if short_sma[i] < long_sma[i] and short_sma[i-1] >= long_sma[i-1]:
        print(f"Dead cross identified: day {i}")
Market analysis utilizing moving averages and TA-Lib can provide crucial information to investors. From simple moving averages to complex indicators such as the golden cross and dead cross, various methods can analyze market trends and shifts. This insight helps in planning and executing investment strategies more precisely and in comprehending subtle market movements.
FAQs
How can I install TA-Lib?
- Various methods are available for installing TA-Lib, and detailed instructions can be found at [TA-Lib] #2: Installing TA-Lib for Technical Analysis.
What other indicators can I calculate using TA-Lib besides moving averages?
- TA-Lib offers over 150 technical indicators, including Bollinger Bands, RSI, MACD, etc. Stay tuned to this series as we plan to cover these other indicators in detail.
How can I know when a golden cross or dead cross occurs?
- Golden and dead crosses occur when short-term moving averages break above or below long-term moving averages, respectively. You can identify these signals by using the code examples provided.
What other technical indicators might be useful for novice investors?
- For novice investors, indicators like RSI (Relative Strength Index), MACD (Moving Average Convergence Divergence), and Bollinger Bands may be valuable. These measures gauge price relative strength and volatility, so using them alongside moving averages can aid in analyzing various facets of the market.
Are there limitations to using only moving average line analysis? How should it be combined with other analytical methods?
- While moving average lines are useful in discerning general market trends, they may have limitations in analyzing complex market situations or specific events. It is advisable to complement them with fundamental analysis, other technical indicators, economic indicators, etc., to create a comprehensive investment strategy. Combining various analytical methods allows for a more accurate understanding and prediction of the multifaceted aspects of the market.