
[TA-Lib] #3: Moving Averages - Market Trends and Key Indicators
- CloneCoding
- Searies / TA-Lib
- August 16, 2023
In the previous post, we looked in detail at the installation process of TA-Lib, which is essential for financial market analysis, and general troubleshooting.
In this post, we'll explore the basic theory of moving averages. This will allow us to understand and predict market trends. If you want to see right away how to implement moving average analysis using TA-Lib, please check [TA-Lib] #4: Moving Average Analysis - Golden & Dead Cross.
What Are Moving Averages?
Definition and Explanation
Definition: A moving average is a process of averaging data at regular time intervals, typically calculating the average value over a period.
Purpose: It is used to track market trends or detect long-term patterns, helping to remove noise from complex data and clarify the main trends.
Advantages: It can identify long-term trends while smoothing short-term fluctuations.
Types and Characteristics
Short, Medium, Long-Term Moving Averages
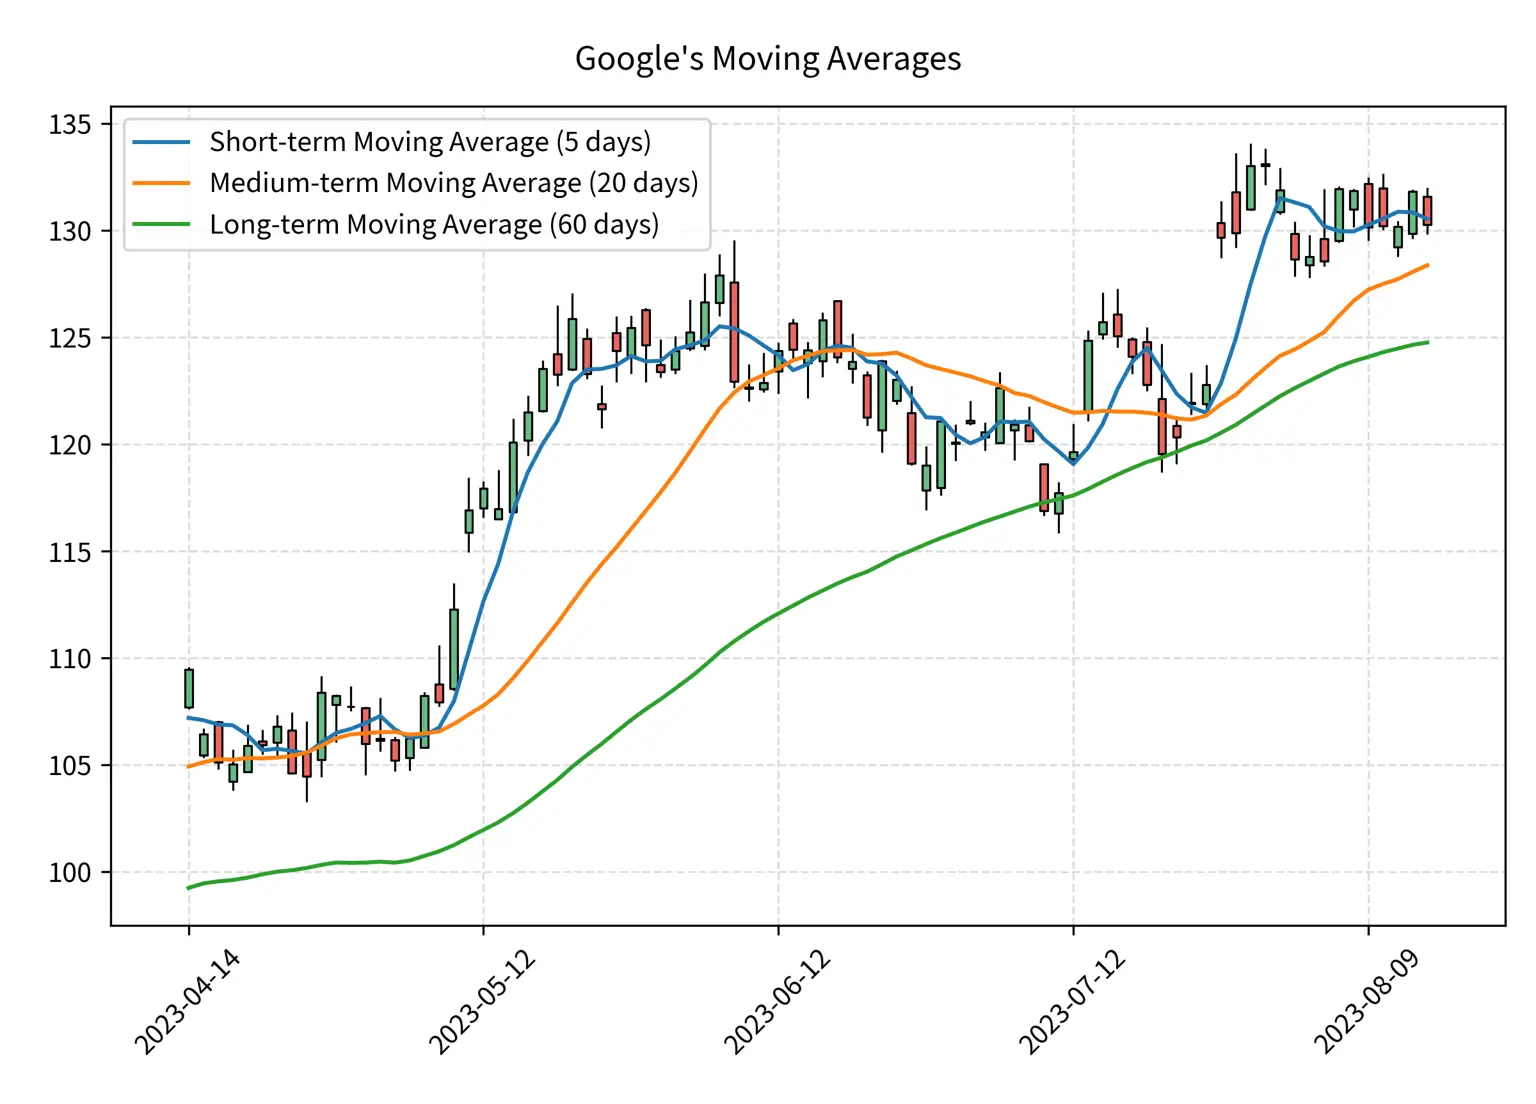
Moving averages are classified as short, medium, or long-term for trend analysis. The characteristics of each category are as follows:
- Short-Term Moving Average Line: Generally represents an average of 5-20 days, reacting sensitively to rapid market changes.
- Medium-Term Moving Average Line: Represents an average of 20-50 days, used for analyzing medium-term market trends.
- Long-Term Moving Average Line: Represents an average of more than 50 days, suitable for evaluating long-term market trends.
Simple, Exponential, Weighted Moving Averages
Based on the calculation method, moving averages are divided into simple, exponential, and weighted categories. The characteristics of each category are as follows:
- Simple Moving Average (SMA): The sum of prices over a specific period is divided by the period.
- Exponential Moving Average (EMA): More weight is given to recent data, which is combined with the previous EMA.
- Weighted Moving Average (WMA): Weights are assigned to specific period data, summed, and then divided by the sum of the weights.
Calculation of Moving Averages
- Simple Moving Average (SMA) Calculation:
- Exponential Moving Average (EMA) Calculation:
- Weighted Moving Average (WMA) Calculation:
Moving averages play a vital role in analyzing and tracking various trends in the financial market, and they are used to accurately understand the market's situation in various periods and methods.
Utilization of Moving Averages
Moving averages are a useful tool for smoothing out short-term fluctuations in the market to understand medium and long-term trends. Traders and investors use them to determine the direction of the market and decide on appropriate entry and exit points.
Market Trend Analysis
Analyzing market trends is an essential basis for investment decisions. Moving averages are used as follows:
- 20-Day Moving Average Line: Mainly analyzes short-term trends, capturing rapid market changes.
- 60-Day Moving Average Line: Analyzes medium-term trends and helps reduce the impact of short-term volatility.
- 120-Day Moving Average Line: Used for long-term trend analysis and is useful for understanding the overall direction of the market.
Signal and Warning Systems
Signal and warning systems utilizing moving averages help identify significant inflection points in the market.
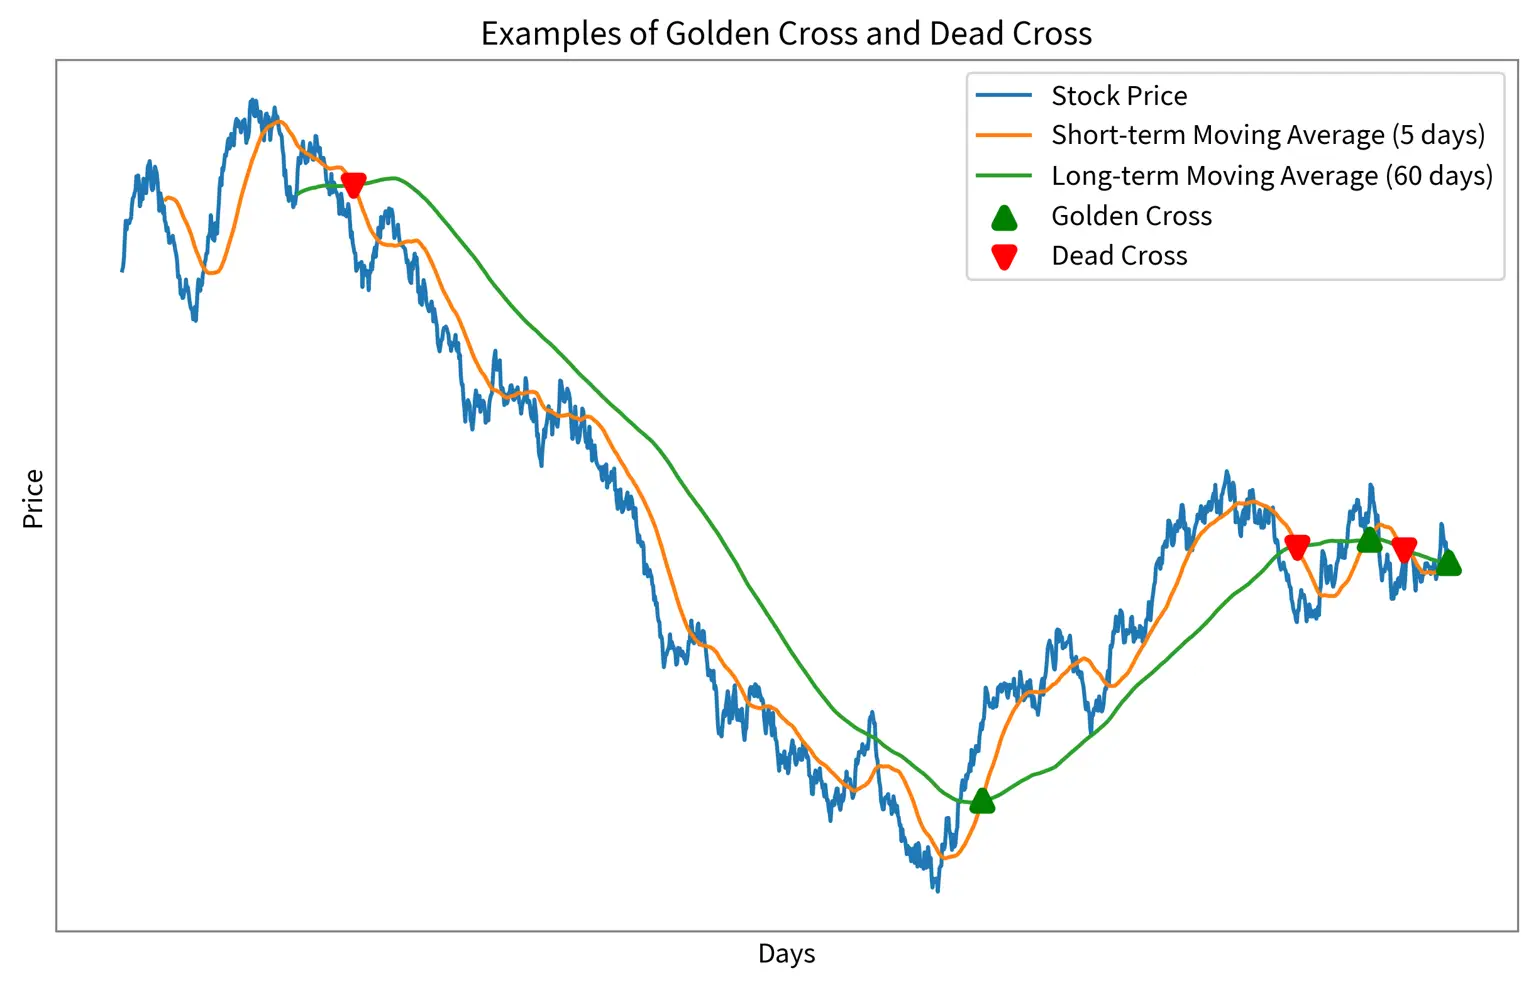
Golden Cross
The Golden Cross refers to the phenomenon when a short-term moving average crosses above a long-term moving average. This occurrence is typically interpreted as the beginning of a bullish market, often signaling a buying opportunity for many investors and traders. For instance, when a 50-day moving average surmounts a 200-day moving average, it's characterized as a Golden Cross, suggesting the conclusion of a declining trend and the potential commencement of a new upward trajectory.
Death Cross
Conversely, the Death Cross signifies the situation where a short-term moving average descends below a long-term moving average. This event heralds the onset of a bearish market and can be construed as a selling signal. Similarly, when the 50-day moving average falls beneath the 200-day moving average, it's interpreted as a Death Cross, indicating the end of the existing upward trend and the likely initiation of a new downward trend.
These two phenomena serve as pivotal indicators for market participants, acting as essential tools for capturing long-term changes in market trends. Recognizing and utilizing the Golden Cross and Death Cross accurately is paramount in formulating investment strategies.
Moving averages are indispensable tools in filtering out market noise and elucidating main trends. Various forms and methods of calculation, such as short-term, medium-term, long-term moving averages, and simple, exponential, and weighted moving averages, enable the analysis of different aspects of the market. In particular, phenomena like the Golden Cross and Death Cross play a crucial role in detecting significant turning points in the market, significantly influencing investment decisions.
FAQs
- What is a moving average?
- A moving average is the process of averaging consecutive, uniform intervals of data, mainly utilized for discerning market trends or eliminating the complexities of data noise.
- What are the primary uses of moving averages?
- Moving averages are employed to mitigate short-term market fluctuations and identify long-term trends. Investors and traders utilize them to determine suitable entry and exit points.
- What are the Golden Cross and Death Cross?
- The Golden Cross is a phenomenon where the short-term moving average breaches the long-term moving average upwards, symbolizing the inception of a bullish market. Conversely, the Death Cross is when the short-term moving average breaks below the long-term moving average, forecasting the commencement of a bearish market.
- What methods are there for calculating moving averages?
- The predominant methods for calculating moving averages include Simple Moving Average (SMA), Exponential Moving Average (EMA), and Weighted Moving Average (WMA), each computed using distinct formulas.
- How can moving averages be used to make investment decisions?
- Moving averages facilitate the identification of market trends and significant inflection points. Traders and investors apply this information to gauge market direction and develop corresponding buy or sell strategies.
Other Posts in the Searies / TA-Lib
CloneCoding
Innovation Starts with a Single Line of Code!
Categories
- Language(47)
- Web(19)
- Searies(7)
- Tips & Tutorial(4)
Recent Posts
![[JavaScript] Downloading Screenshots using html2canvas]() Learn how to download webpage screenshots using the html2canvas library. Dive into its features, advantages, installation, usage, and things to watch out for.
Learn how to download webpage screenshots using the html2canvas library. Dive into its features, advantages, installation, usage, and things to watch out for.![[CSS] Dark Mode Guide: System & User-Based CSS Implementation]() Explore methods to implement dark mode on your webpage. Understand how to use system settings and user choices for effective dark mode transitions.
Explore methods to implement dark mode on your webpage. Understand how to use system settings and user choices for effective dark mode transitions.![[Next.js] When to Use SSR, SSG, and CSR - Ideal Use Cases Explored]() In Next.js, we detail which rendering method, be it SSR, SSG, or CSR, is best suited for different site categories.
In Next.js, we detail which rendering method, be it SSR, SSG, or CSR, is best suited for different site categories.![[CSS] Pseudo Selector Guide - Essential Styling Techniques]() An in-depth look into CSS pseudo selectors. Learn about :first-child, :last-child, :nth-child(n) and more. Discover practical application scenarios.
An in-depth look into CSS pseudo selectors. Learn about :first-child, :last-child, :nth-child(n) and more. Discover practical application scenarios.![[Next.js] SSR vs. CSR vs. SSG: Understanding Web Rendering Techniques]() A deep dive into the three rendering methods in Next.js: Server Side Rendering (SSR), Client Side Rendering (CSR), and Static Site Generation (SSG), exploring their workings, benefits, and drawbacks.
A deep dive into the three rendering methods in Next.js: Server Side Rendering (SSR), Client Side Rendering (CSR), and Static Site Generation (SSG), exploring their workings, benefits, and drawbacks.
![[JavaScript] Downloading Screenshots using html2canvas](https://img.clonecoding.com/thumb/101/16x9/320/javascript-downloading-screenshots-using-html2canvas.webp)
![[CSS] Dark Mode Guide: System & User-Based CSS Implementation](https://img.clonecoding.com/thumb/100/16x9/320/css-dark-mode-guide-system-user-based-css-implementation.webp)
![[Next.js] When to Use SSR, SSG, and CSR - Ideal Use Cases Explored](https://img.clonecoding.com/thumb/99/16x9/320/next-js-when-to-use-ssr-ssg-and-csr-ideal-use-cases-explored.webp)
![[CSS] Pseudo Selector Guide - Essential Styling Techniques](https://img.clonecoding.com/thumb/98/16x9/320/css-pseudo-selector-guide-essential-styling-techniques.webp)
![[Next.js] SSR vs. CSR vs. SSG: Understanding Web Rendering Techniques](https://img.clonecoding.com/thumb/97/16x9/320/next-js-ssr-vs-csr-vs-ssg-understanding-web-rendering-techniques.webp)