
[TA-Lib] #5 MACD - Analyzing MACD Meaning and Its Role in Market Trends
- CloneCoding
- Searies / TA-Lib
- August 24, 2023
Moving Average Convergence Divergence (MACD) is a widely used technical indicator among traders, analyzing market trends through the difference in moving averages. Previous posts explored the basic concepts of moving averages and analysis using TA-Lib.
- Concepts of Moving Averages: [TA-Lib] #3: Moving Averages - Market Trends and Key Indicators
- Moving Average Analysis Using TA-Lib: [TA-Lib] #4: Moving Average Analysis - Golden & Dead Cross
In this post, we will delve into the definition, components, applications, and limitations of the MACD indicator. If you wish to directly learn how to implement MACD analysis using TA-Lib, please refer to [TA-Lib] #6: Analyzing and Calculating MACD with TA-Lib.
MACD (Moving Average Convergence Divergence) Indicator
Definition and History
Developed by Gerald Appel in the 1970s, the MACD indicator measures market momentum through the difference between two Exponential Moving Averages (EMAs). With one representing a relatively short-term average and the other a long-term average, this difference enables the detection of price trend changes and velocity. Consequently, MACD is widely employed for detecting trend-following and contrarian patterns, solidifying its place as a popular technical analysis tool among investors and traders.
Components and Formulae
MACD Line
The MACD Line represents the core element of MACD, indicating the difference between the short-term moving average (typically a 12-day period) and the long-term moving average (generally a 26-day period).
- Formula:
- 12-day EMA: An exponential weighted moving average over the most recent 12-day span, sensitive to rapid changes.
- 26-day EMA: An exponential weighted moving average over the last 26 days, reflecting long-term market trends.
- Interpretation: Utilized to gauge the overall momentum and trend of the market.
Signal Line
The Signal Line is the 9-day moving average of the MACD Line.
- Formula:
- Interpretation:
- Considered a vital trading signal when the MACD Line crosses the Signal Line.
- Interpreted as a buying signal when the MACD Line ascends above the Signal Line, and a selling signal when it descends below.
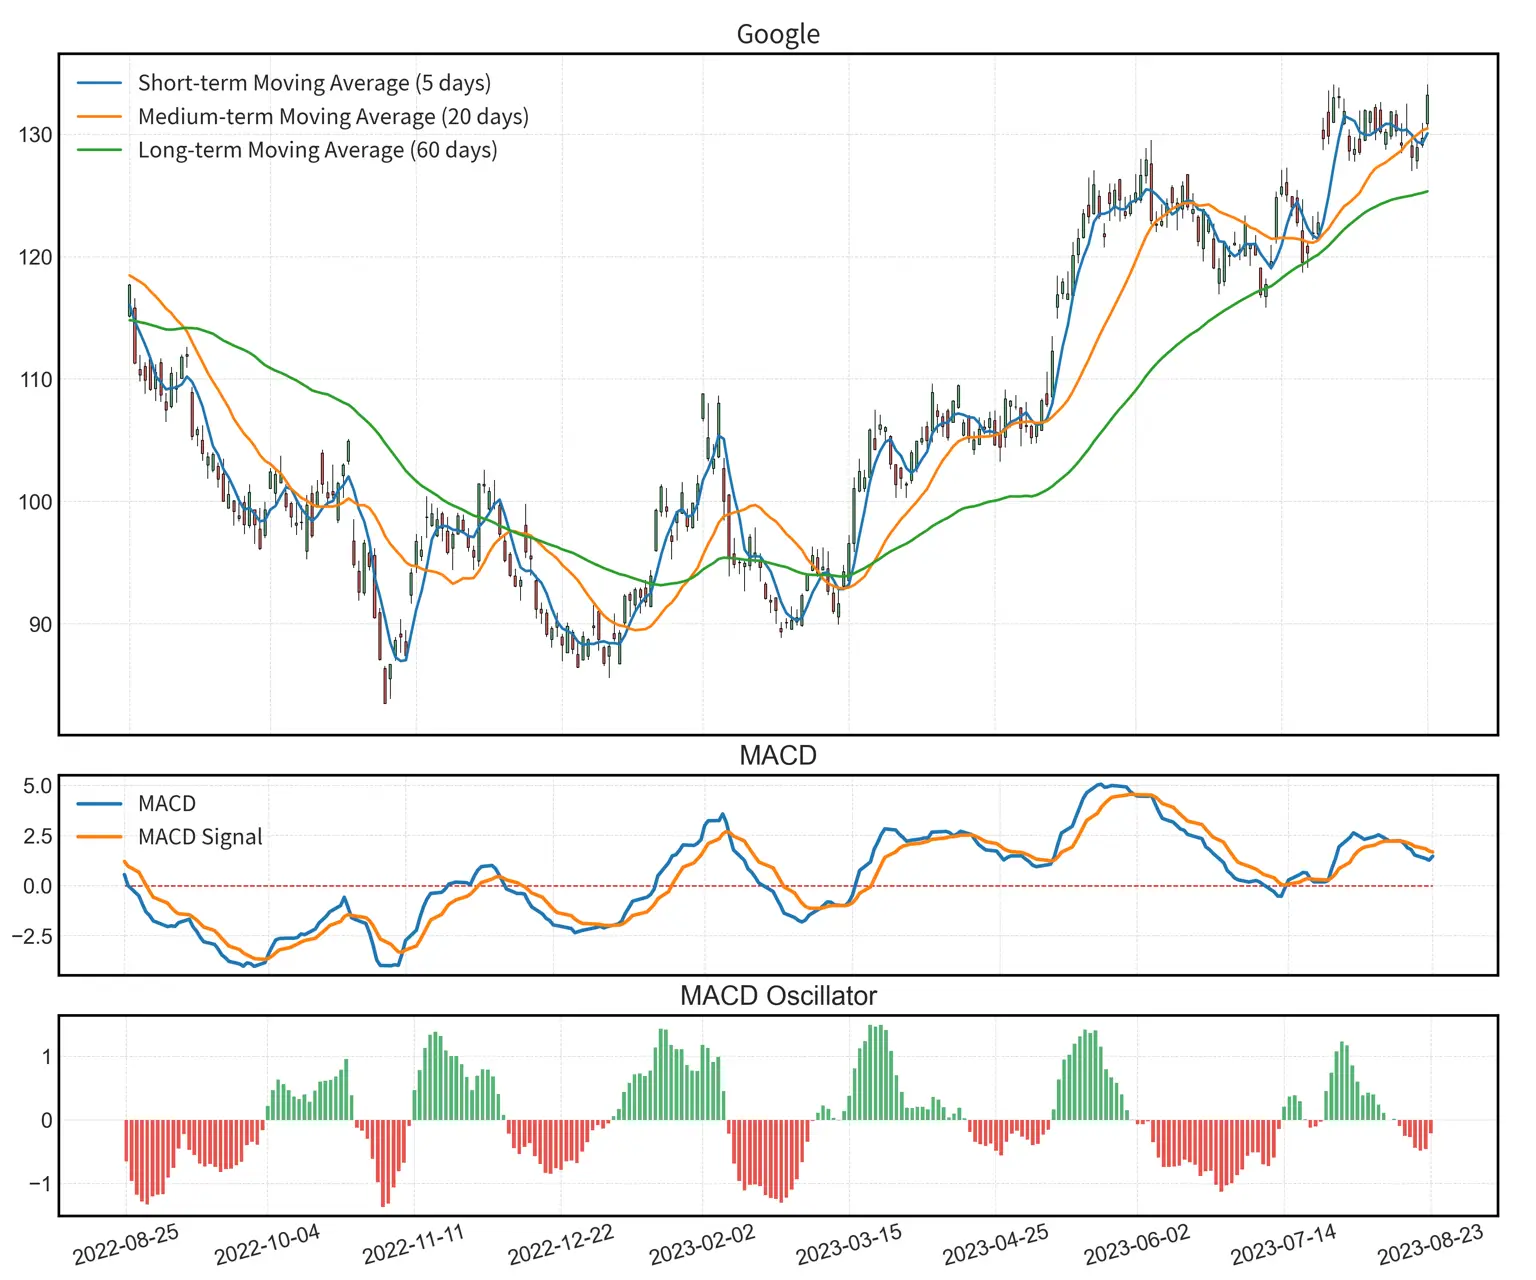
Histogram
The Histogram graphically portrays the difference between the MACD Line and Signal Line.
- Formula:
- Interpretation:
- A positive value indicates the MACD Line is above the Signal Line, while a negative value indicates it is below.
- A greater magnitude signifies a larger difference between the two lines, potentially representing strong market momentum.
- The crossing of zero may signify an impending shift in the trend.
Applications
MACD is a versatile indicator capable of informing various investment strategies and market analyses, particularly employed in trend-following and in identifying overbought/oversold conditions.
Trend Following
Crossing of MACD Line and Signal Line
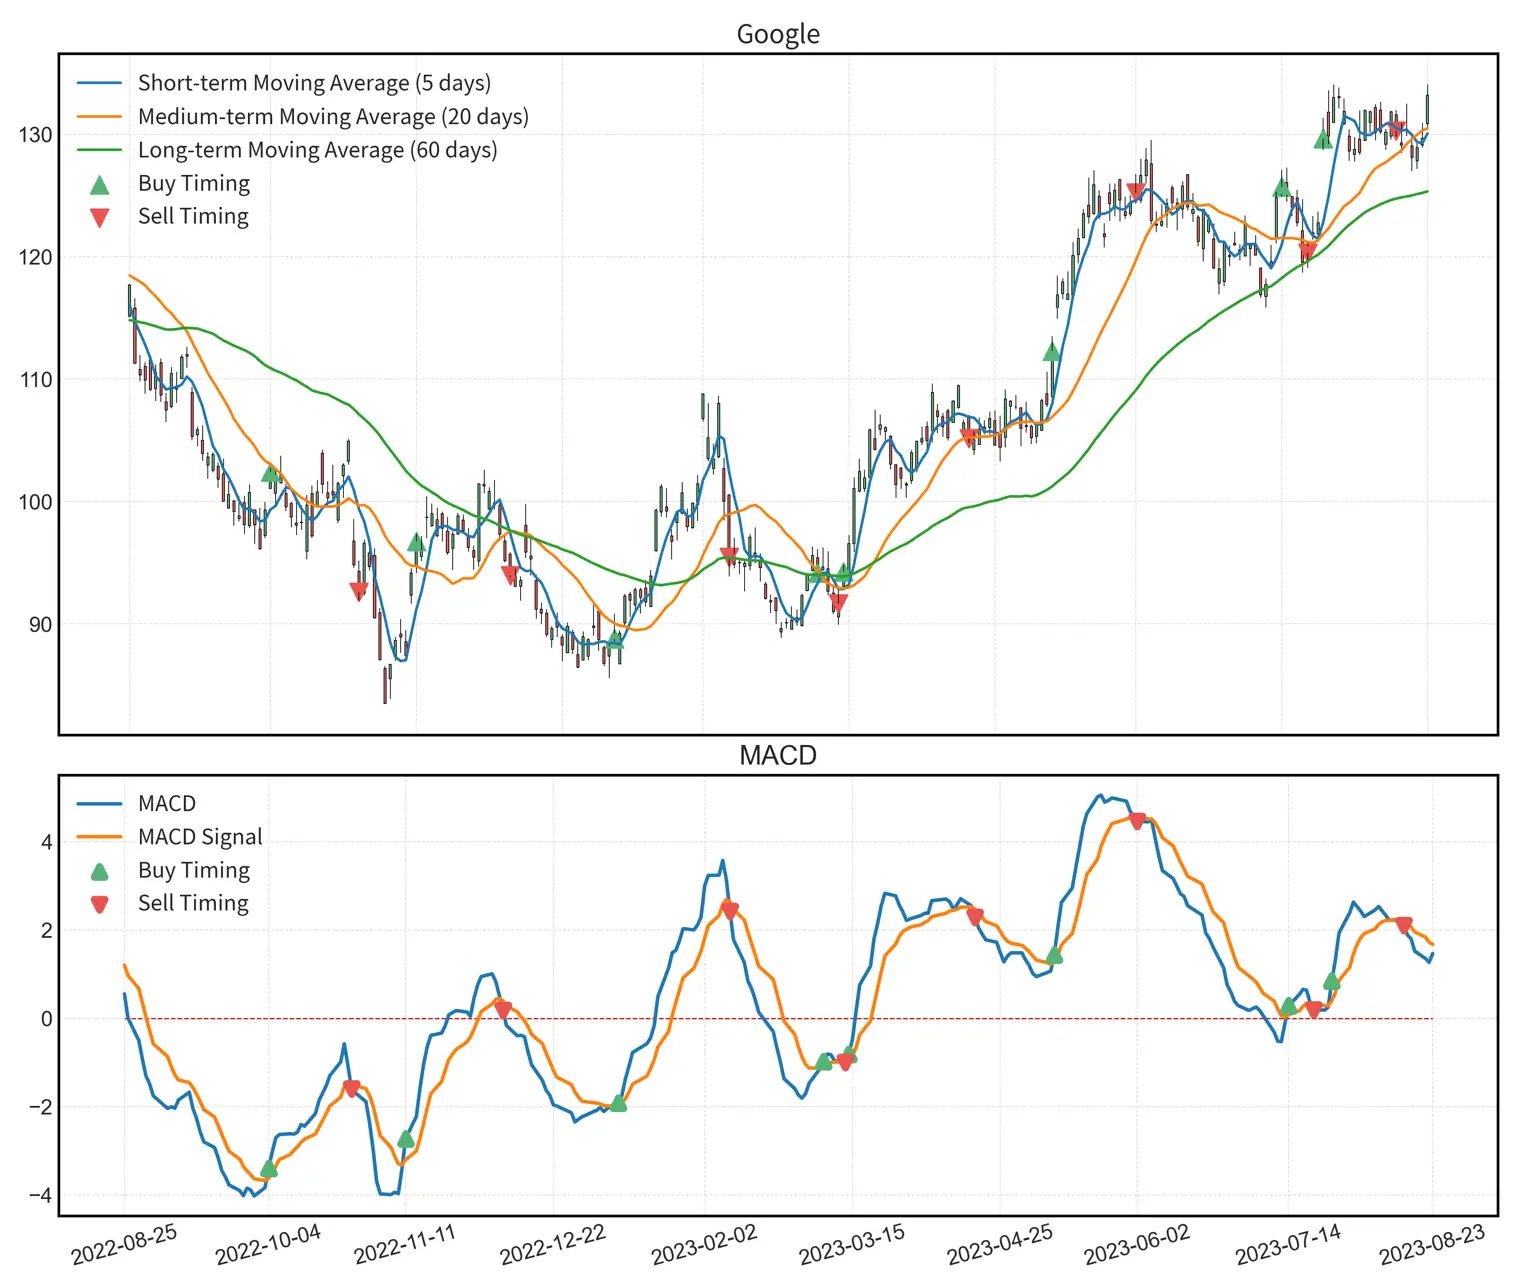
- Buying Timing: When the MACD Line crosses the Signal Line from below to above, this may signal the commencement of an upward trend, representing an opportunity to buy.
- Selling Timing: Conversely, when the MACD Line crosses the Signal Line from above to below, this may warn of the beginning of a downward trend, serving as a selling cue.
Size of the Histogram
- Strong Trend: As the size of the Histogram grows, the current trend (whether rising or falling) is intensifying.
- Weakening Trend: A diminishing size indicates that the trend is weakening, possibly necessitating position adjustments.
Detection of Overbought/Oversold Points
Divergence of MACD Line and Signal Line
- Selling Timing: If the two lines are excessively divergent, the market might be in an overheated (overbought) condition, interpreted as a selling signal.
- Buying Timing: Conversely, when the two lines are closely aligned, the market may be in an oversold condition, presenting a buying opportunity.
Zero Line Crossing
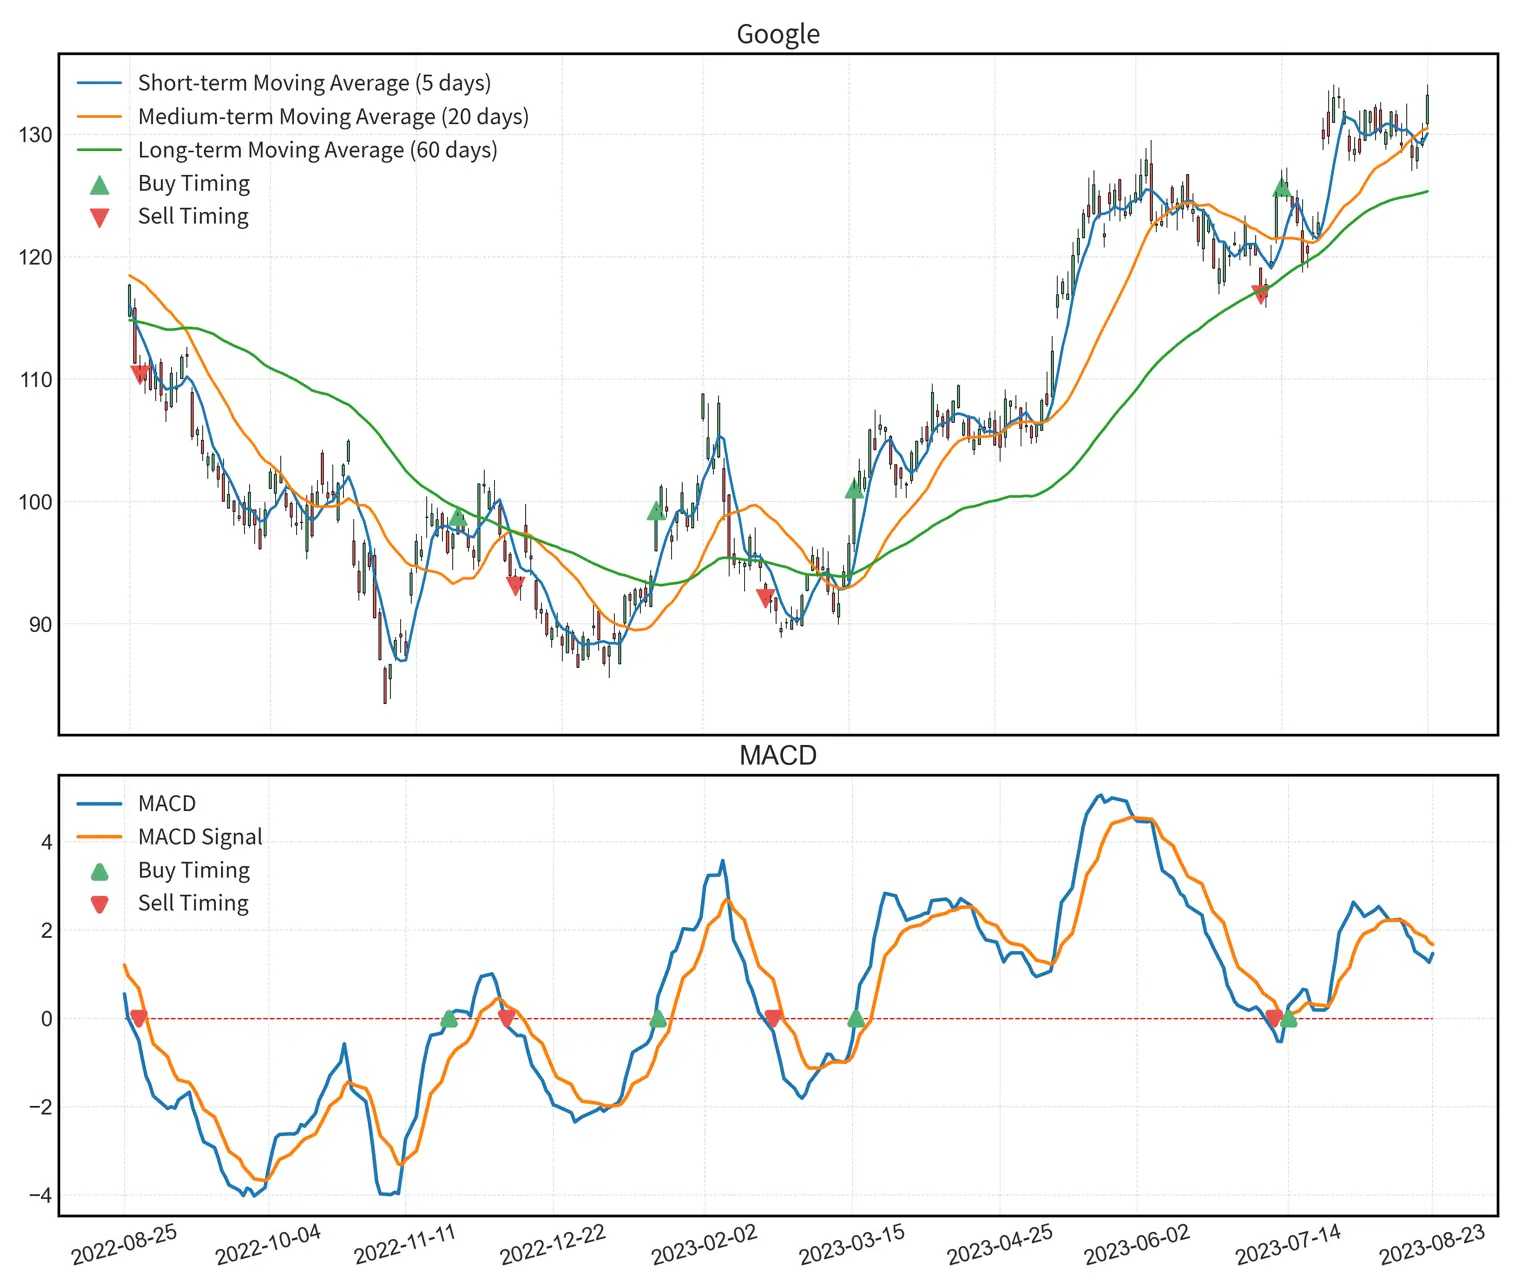
- Buying Timing: When the MACD Line crosses the zero line upwards, it may signify the termination of an oversold market condition, offering a buying opportunity.
- Selling Timing: When the MACD Line crosses the zero line downwards, it may indicate the end of an overheated market condition, interpreted as a selling signal.
In employing MACD to discern buying and selling points, it is essential to combine it with other technical indicators and adapt it according to individual investment strategies and objectives.
Limitations and Considerations of MACD
While playing a crucial role in many investment strategies, MACD does not function perfectly in all scenarios. Understanding these limitations and tips for successful utilization is key.
Limitations
- Delayed Signals: As MACD is based on moving averages, it may provide delayed signals, leading to missed opportunities.
- Inefficiency in Trendless Markets: In sideways markets, MACD may become unreliable, generating false signals.
- Dependence on Historical Data: Relying on past data, MACD may struggle to predict future market changes.
Tips for Successful Utilization
- Combination with Other Indicators: Employing MACD in conjunction with other indicators enhances accuracy.
- Understanding Market Conditions: Effective use of MACD requires understanding market trends and choosing appropriate settings.
- Monitoring: Continuous monitoring is essential due to the potential delays in MACD signals.
MACD can be a potent investment tool, yet it is not infallible on its own. Grasping various limitations and devising strategies to overcome them is vital.
FAQs
- What is the MACD indicator, and how is it structured?
- The MACD (Moving Average Convergence Divergence) is an indicator that measures market momentum through the difference between two Exponential Moving Averages (EMA). It is primarily composed of three elements: the MACD Line (the difference between the 12-day and 26-day EMA), the Signal Line (the 9-day EMA of the MACD Line), and the Histogram (the difference between the MACD Line and Signal Line).
- What are the limitations to be cautious of when using the MACD indicator?
- The major limitations of the MACD include the provision of lagging signals, inefficiency in sideways markets, and reliance on historical data. Due to these constraints, caution is advised when using the MACD alone, and it is beneficial to utilize it in conjunction with other indicators.
- What are the primary applications of using the MACD?
- The MACD is predominantly utilized for trend following and detection of overbought/oversold points. The crossing of the MACD Line and Signal Line, changes in the size of the Histogram, etc., aid in determining optimal buying and selling opportunities.
- What impact does changing the parameters of the MACD have?
- Altering the parameters of the MACD, specifically the periods of the short and long-term moving averages, affects the sensitivity of the MACD. Accurate configuration of parameters suited to specific markets and strategies is essential to achieve precise analysis results, and sensitivity adjustment allows the investor to tailor the MACD to their objectives and strategies.
- Why is the combination of the MACD indicator with other technical indicators important?
- While the MACD is a potent tool, it is not flawless and has inherent limitations. By complementing it with other technical indicators, a more precise analysis becomes attainable. This complementary approach allows consideration of various market aspects, thereby reducing risks associated with erroneous signals and facilitating the development of more effective investment strategies.
Other Posts in the Searies / TA-Lib
CloneCoding
Innovation Starts with a Single Line of Code!
Categories
- Language(47)
- Web(19)
- Searies(7)
- Tips & Tutorial(4)
Recent Posts
![[JavaScript] Downloading Screenshots using html2canvas]() Learn how to download webpage screenshots using the html2canvas library. Dive into its features, advantages, installation, usage, and things to watch out for.
Learn how to download webpage screenshots using the html2canvas library. Dive into its features, advantages, installation, usage, and things to watch out for.![[CSS] Dark Mode Guide: System & User-Based CSS Implementation]() Explore methods to implement dark mode on your webpage. Understand how to use system settings and user choices for effective dark mode transitions.
Explore methods to implement dark mode on your webpage. Understand how to use system settings and user choices for effective dark mode transitions.![[Next.js] When to Use SSR, SSG, and CSR - Ideal Use Cases Explored]() In Next.js, we detail which rendering method, be it SSR, SSG, or CSR, is best suited for different site categories.
In Next.js, we detail which rendering method, be it SSR, SSG, or CSR, is best suited for different site categories.![[CSS] Pseudo Selector Guide - Essential Styling Techniques]() An in-depth look into CSS pseudo selectors. Learn about :first-child, :last-child, :nth-child(n) and more. Discover practical application scenarios.
An in-depth look into CSS pseudo selectors. Learn about :first-child, :last-child, :nth-child(n) and more. Discover practical application scenarios.![[Next.js] SSR vs. CSR vs. SSG: Understanding Web Rendering Techniques]() A deep dive into the three rendering methods in Next.js: Server Side Rendering (SSR), Client Side Rendering (CSR), and Static Site Generation (SSG), exploring their workings, benefits, and drawbacks.
A deep dive into the three rendering methods in Next.js: Server Side Rendering (SSR), Client Side Rendering (CSR), and Static Site Generation (SSG), exploring their workings, benefits, and drawbacks.
![[JavaScript] Downloading Screenshots using html2canvas](https://img.clonecoding.com/thumb/101/16x9/320/javascript-downloading-screenshots-using-html2canvas.webp)
![[CSS] Dark Mode Guide: System & User-Based CSS Implementation](https://img.clonecoding.com/thumb/100/16x9/320/css-dark-mode-guide-system-user-based-css-implementation.webp)
![[Next.js] When to Use SSR, SSG, and CSR - Ideal Use Cases Explored](https://img.clonecoding.com/thumb/99/16x9/320/next-js-when-to-use-ssr-ssg-and-csr-ideal-use-cases-explored.webp)
![[CSS] Pseudo Selector Guide - Essential Styling Techniques](https://img.clonecoding.com/thumb/98/16x9/320/css-pseudo-selector-guide-essential-styling-techniques.webp)
![[Next.js] SSR vs. CSR vs. SSG: Understanding Web Rendering Techniques](https://img.clonecoding.com/thumb/97/16x9/320/next-js-ssr-vs-csr-vs-ssg-understanding-web-rendering-techniques.webp)