
[TA-Lib] #7: Understanding and Applying the RSI (Relative Strength Index)
- CloneCoding
- Searies / TA-Lib
- September 1, 2023
So far, we've delved into various technical analysis methods, primarily focusing on TA-Lib. We've covered everything from the foundational concepts of technical analysis ([TA-Lib] #1 Exploring the Essentials of Technical Analysis and TA-Lib), the installation process of TA-Lib ([TA-Lib] #2: Installing TA-Lib for Technical Analysis), to discerning market trends using various technical indicators.
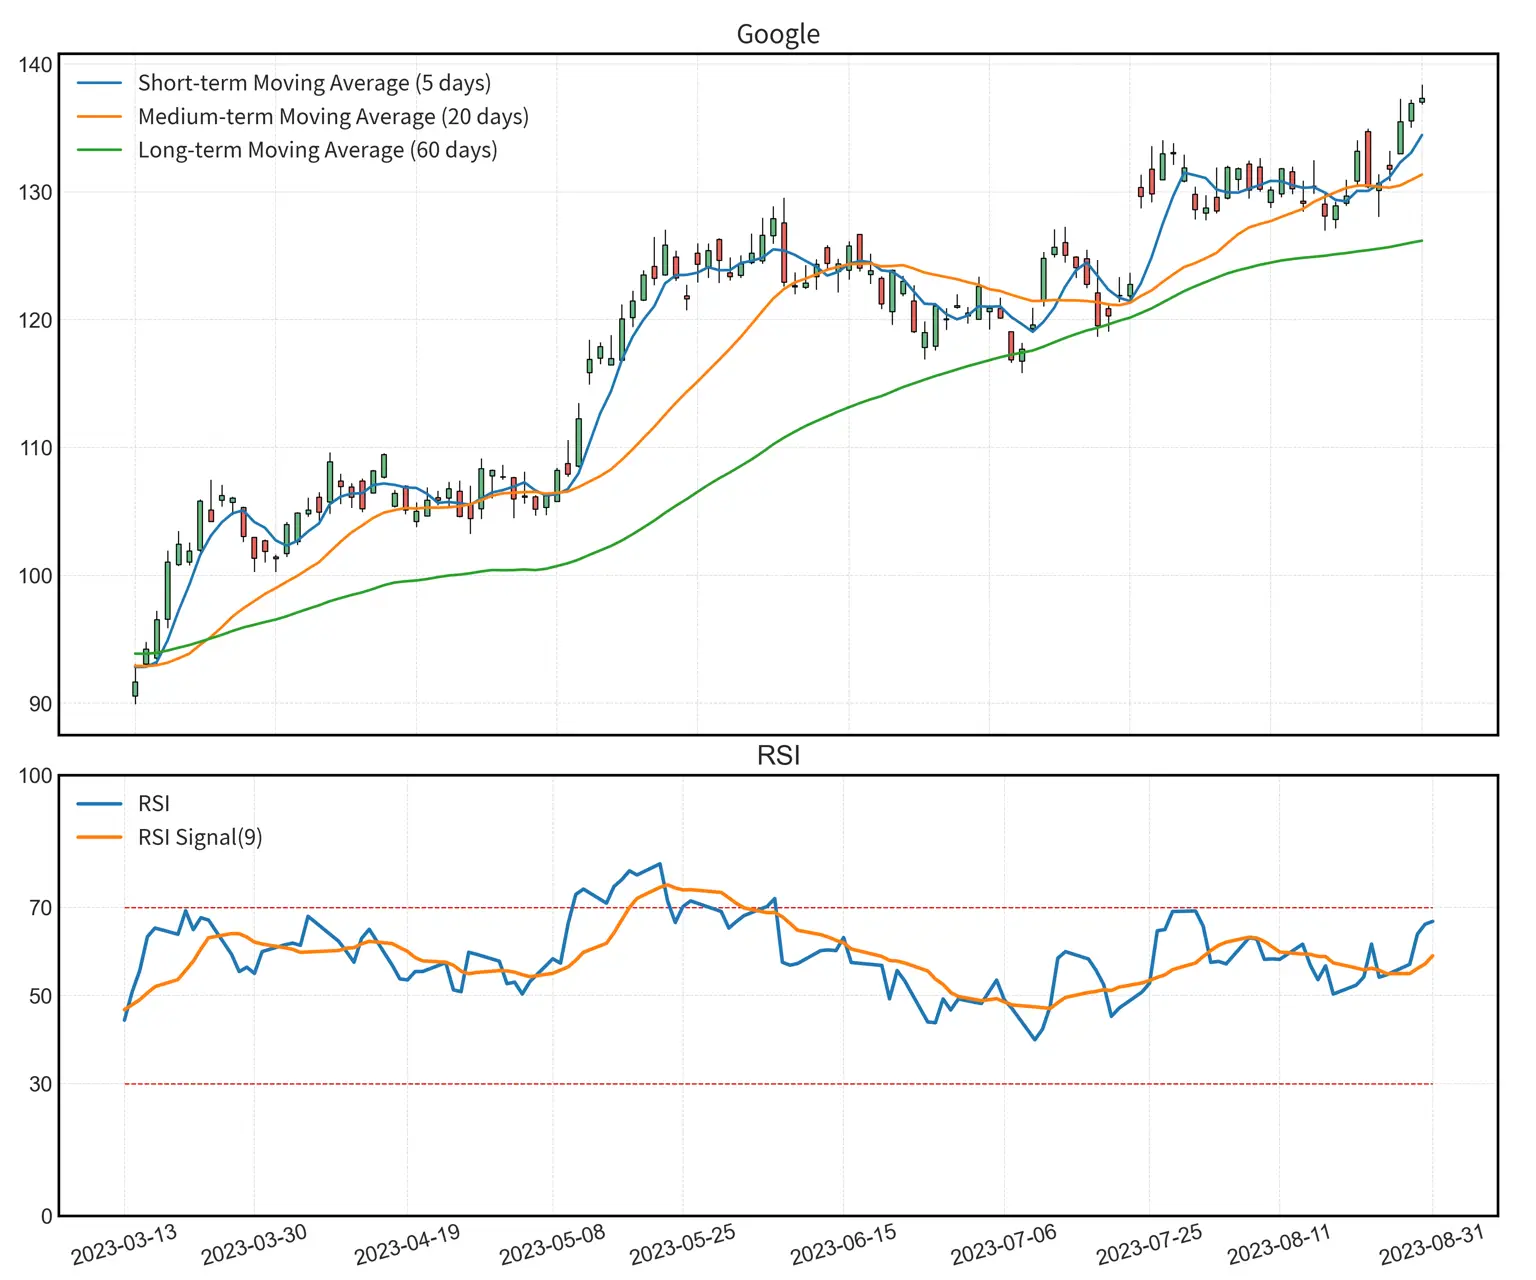
Today, we'll dive deep into the widely utilized RSI (Relative Strength Index) in the stock market. The RSI serves as a pivotal indicator, helping to determine whether the current stock price is overheated or has excessively plummeted. Let's explore how the RSI operates and how it can be effectively employed.
Concept of RSI (Relative Strength Index)
The RSI, also known as the 'Relative Strength Index', stands as a prominent momentum indicator frequently employed across financial markets, including stocks, futures, and foreign exchange. Introduced in 1978 by J. Welles Wilder Jr., this indicator assists in evaluating whether the current stock price is overheated or has excessively declined.
Components and Formulas
The RSI is computed based on the stock's upward and downward movements. To grasp this, one must understand a few fundamental components and their corresponding formulas:
- U (Up) and D (Down) U (Up): Represents the upward movement when the stock price rises compared to the previous day. If the stock price declines, U is 0. D (Down): Represents the downward movement when the stock price drops compared to the previous day. If the stock price rises, D is 0.
- AU (Average Up) and AD (Average Down) AU (Average Up): The average value of U over a specific period, typically 14 days. AD (Average Down): The average value of D over a specific period, typically 14 days.
- RS (Relative Strength) RS (Relative Strength): The ratio of AU to AD, indicating the relative strength of the stock's upward and downward movements.
- RSI (Relative Strength Index) RSI: An indicator based on RS, used to determine whether the stock is in an overbought or oversold condition.
- RSI Signal RSI Signal: The moving average of RSI, smoothing out its fluctuations to provide clearer signals. Typically, a 9-day moving average is used.
Principle of the Formula
The RSI (Relative Strength Index) serves as a barometer to gauge the market's potential overheating or excessive downturn. When stock prices rise consecutively, the RS increases, pushing the RSI closer to 100. Conversely, as stock prices fall continuously, the RS decreases, drawing the RSI nearer to 0.
An RSI value exceeding 70 typically indicates an overbought condition, suggesting a higher likelihood of a price decline. On the other hand, an RSI value below 30 signifies an oversold condition, indicating a potential price surge.
Traders and investors utilize the RSI to assess market conditions and subsequently make informed buy or sell decisions.
Interpretation and Application of RSI
The RSI, which contrasts the upward and downward momentum of stock prices, offers a spectrum of interpretations and applications based on its value.
RSI Interpretation
- Overbought/Oversold Zones
- Above 70: The stock is perceived as overbought. This suggests that while the stock is on an upward trajectory, a reversal might be imminent.
- Below 30: The stock is considered oversold, indicating that despite its downward trend, a reversal could be on the horizon.
- Neutral Zone
- Between 30 and 70: The stock is deemed stable without any distinct trend. In this range, relying solely on the RSI for decision-making can be challenging, thus it's advisable to incorporate other technical indicators for a comprehensive analysis.
- RSI Divergence
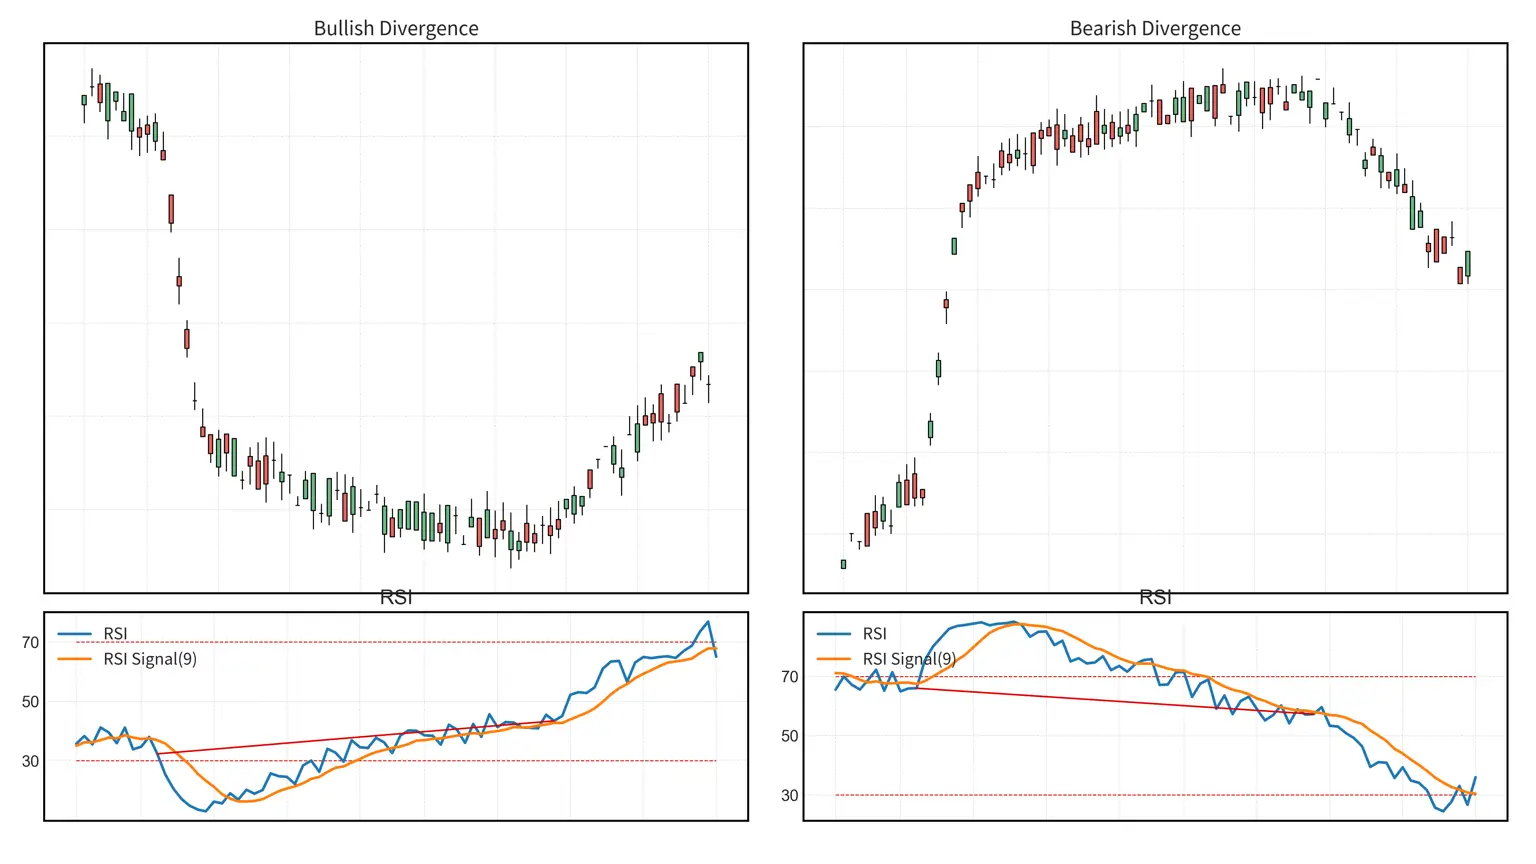
A simulated image. The left chart showcases a Bullish Divergence where stock prices decline as the RSI ascends, while the right chart illustrates a Bearish Divergence where stock prices rise as the RSI descends. Both stock price and RSI movements can be analyzed to discern each pattern. - Bullish Divergence: When stock prices consistently decline while the RSI ascends, it's interpreted as a signal that a positive reversal in stock prices might be forthcoming.
- Bearish Divergence: Conversely, when stock prices consistently rise while the RSI descends, it's seen as an indication that a negative reversal in stock prices could be imminent.
RSI Application Strategies
- Dual Approach: Monitor both the RSI and stock price charts closely, especially when entering overbought or oversold zones. If the RSI exceeds 70 or drops below 30, scrutinize the stock price chart for any volatility or distinct patterns.
- Combination with Other Indicators: For more accurate signals, combine the RSI with other technical indicators such as moving averages, MACD, or Bollinger Bands.
- Utilizing RSI Divergence: The divergence in RSI can be a valuable signal for predicting stock price reversals. When divergence appears, undergo additional verification processes before making an investment decision.
- Leveraging the RSI Signal Line: Use the 9-day moving average of the RSI, known as the RSI signal line, to identify crossover points. An upward crossover of the RSI over the signal line can be interpreted as a buy signal, while a downward crossover can be seen as a sell signal.
The RSI is a potent tool for assessing the upward and downward momentum of stock prices in the market. However, like all technical indicators, basing investment decisions solely on the RSI can be perilous. It's crucial to analyze a myriad of indicators and information to make judicious investment decisions.
Advantages and Disadvantages of RSI
Advantages
- Simplicity: The RSI is presented as a value between 0 and 100, offering a straightforward and intuitive interpretation. Clear benchmarks at 70 and 30 allow for easy identification of overbought and oversold conditions.
- Versatility Across Markets: The RSI can be applied in various financial markets, including stocks, forex, futures, and cryptocurrencies.
- Early Detection of Market Reversals: Divergences in the RSI can be invaluable for detecting potential market reversals, allowing investors to anticipate market shifts.
Disadvantages
- Excessive Signals: Especially in volatile markets, the RSI can frequently enter overbought or oversold zones, potentially leading to redundant buy or sell signals.
- Limitations in Strong Trend Markets: During persistent bullish or bearish trends, the RSI can remain in overbought or oversold territories for extended periods. Relying solely on the RSI in such scenarios can be perilous.
- Lagging Indicator: As the RSI is calculated based on historical data, it might not immediately reflect real-time market changes.
Tips for Effective RSI Utilization
- Combination with Other Indicators: Rather than using the RSI in isolation, integrating it with other technical indicators can yield more accurate signals. For instance, analyzing the RSI alongside moving averages, Bollinger Bands, and MACD can lead to more informed investment decisions.
- Consider Market Characteristics: The default setting for the RSI is 14 days. However, depending on the specific market's characteristics, adjusting this period might be necessary. For a more granular view of market volatility, consider shortening the RSI period.
- Closely Monitor Divergences: Divergences in the RSI are crucial signals for predicting potential market reversals. By observing both the price chart and the RSI chart, investors can detect market changes early on.
- Filter Excessive Signals: If the RSI frequently enters overbought or oversold zones, consider adjusting the benchmarks to 80 and 20 to reduce redundant signals.
- Practice and Experience: Like any technical indicator, the RSI becomes more effective with practice and experience. Engage in virtual trading or analyze historical data to hone your RSI skills and observe its behavior across various market conditions.
The RSI (Relative Strength Index) has established itself as a pivotal tool in the stock market for comparing bullish and bearish price movements. This indicator swiftly identifies overbought or oversold conditions, providing investors with valuable insights into potential market reversal points.
However, relying solely on the RSI can be risky. It's crucial to integrate it with a range of technical analysis tools to gain a comprehensive understanding of the broader market landscape. By leveraging the diverse functionalities of TA-Lib, such as moving averages ([TA-Lib] #3: Moving Averages - Market Trends and Key Indicators) or MACD ([TA-Lib] #5 MACD - Analyzing MACD Meaning and Its Role in Market Trends), investors can enhance the accuracy of their decision-making process.
Other Posts in the Searies / TA-Lib
CloneCoding
Innovation Starts with a Single Line of Code!
Categories
- Language(47)
- Web(19)
- Searies(7)
- Tips & Tutorial(4)
Recent Posts
![[JavaScript] Downloading Screenshots using html2canvas]() Learn how to download webpage screenshots using the html2canvas library. Dive into its features, advantages, installation, usage, and things to watch out for.
Learn how to download webpage screenshots using the html2canvas library. Dive into its features, advantages, installation, usage, and things to watch out for.![[CSS] Dark Mode Guide: System & User-Based CSS Implementation]() Explore methods to implement dark mode on your webpage. Understand how to use system settings and user choices for effective dark mode transitions.
Explore methods to implement dark mode on your webpage. Understand how to use system settings and user choices for effective dark mode transitions.![[Next.js] When to Use SSR, SSG, and CSR - Ideal Use Cases Explored]() In Next.js, we detail which rendering method, be it SSR, SSG, or CSR, is best suited for different site categories.
In Next.js, we detail which rendering method, be it SSR, SSG, or CSR, is best suited for different site categories.![[CSS] Pseudo Selector Guide - Essential Styling Techniques]() An in-depth look into CSS pseudo selectors. Learn about :first-child, :last-child, :nth-child(n) and more. Discover practical application scenarios.
An in-depth look into CSS pseudo selectors. Learn about :first-child, :last-child, :nth-child(n) and more. Discover practical application scenarios.![[Next.js] SSR vs. CSR vs. SSG: Understanding Web Rendering Techniques]() A deep dive into the three rendering methods in Next.js: Server Side Rendering (SSR), Client Side Rendering (CSR), and Static Site Generation (SSG), exploring their workings, benefits, and drawbacks.
A deep dive into the three rendering methods in Next.js: Server Side Rendering (SSR), Client Side Rendering (CSR), and Static Site Generation (SSG), exploring their workings, benefits, and drawbacks.
![[JavaScript] Downloading Screenshots using html2canvas](https://img.clonecoding.com/thumb/101/16x9/320/javascript-downloading-screenshots-using-html2canvas.webp)
![[CSS] Dark Mode Guide: System & User-Based CSS Implementation](https://img.clonecoding.com/thumb/100/16x9/320/css-dark-mode-guide-system-user-based-css-implementation.webp)
![[Next.js] When to Use SSR, SSG, and CSR - Ideal Use Cases Explored](https://img.clonecoding.com/thumb/99/16x9/320/next-js-when-to-use-ssr-ssg-and-csr-ideal-use-cases-explored.webp)
![[CSS] Pseudo Selector Guide - Essential Styling Techniques](https://img.clonecoding.com/thumb/98/16x9/320/css-pseudo-selector-guide-essential-styling-techniques.webp)
![[Next.js] SSR vs. CSR vs. SSG: Understanding Web Rendering Techniques](https://img.clonecoding.com/thumb/97/16x9/320/next-js-ssr-vs-csr-vs-ssg-understanding-web-rendering-techniques.webp)