[TA-Lib] #4:TA-Libを利用した移動平均線分析 - 市場のトレンドを検出し、ゴールデンクロス・デッドクロスを捕捉
- CloneCoding
- シリーズ / TA-Lib
- 2023年8月16日
TA-Libによる移動平均の実装
TA-Libは、様々な指標の計算において財務市場分析の不可欠な道具となります。TA-Libについての導入は、[TA-Lib] #1 テクニカル分析とTA-Libの基本を探るをご参照いただき、インストール手順については[TA-Lib] #2: 技術的分析のためのTA-Libインストールをご覧ください。yahooqueryを使用して価格データを取得する方法については[Python] Yahooquery:過去の株価データと財務データの取得と管理をご確認ください。
移動平均の計算とコードサンプル
from yahooquery import Ticker
import talib
import pandas as pd

# トヨタの株価データを取得
toyota = Ticker("7203.T")
price_data = toyota.history(period="2y")
close_prices = price_data['close'].values

# 単純移動平均の計算
sma = talib.SMA(close_prices, timeperiod=20)

# 指数移動平均の計算
ema = talib.EMA(close_prices, timeperiod=20)

# 加重移動平均の計算
wma = talib.WMA(close_prices, timeperiod=20)

# 結果の表示
result = pd.DataFrame({
    '終値': close_prices,
    'SMA': sma,
    'EMA': ema,
    'WMA': wma
})
print(result.tail()) 終値 SMA EMA WMA
487 2395.5 2339.800 2361.016998 2382.290476
488 2429.0 2351.350 2367.491570 2390.785714
489 2408.0 2361.175 2371.349515 2396.180952
490 2419.0 2371.225 2375.887657 2401.688095
491 2370.5 2377.750 2375.374547 2401.619048TA-Libを使用した市場トレンド分析
移動平均を活用することで、市場全体のトレンドの分析が可能となります。
last_5_sma = sma[-5:]

# 上昇トレンドの確認
if all(last_5_sma[i] < last_5_sma[i + 1] for i in range(4)):
    print("市場は上昇トレンドにあります。")
# 下降トレンドの確認
elif all(last_5_sma[i] > last_5_sma[i + 1] for i in range(4)):
    print("市場は下降トレンドにあります。")
else:
    print("市場は安定しています。")
この例では、過去5日間の市場トレンドを移動平均を使用して分析します。移動平均が連続して増加する場合は上昇と分類され、減少する場合は下降と分類されます。
sma5 = talib.SMA(close_prices, timeperiod=5)
sma20 = talib.SMA(close_prices, timeperiod=20)
sma60 = talib.SMA(close_prices, timeperiod=60)

# 仮定: 過去5日間の短期、中期、長期の移動平均
short_ma_last_5 = sma5[-5:]
mid_ma_last_5 = sma20[-5:]
long_ma_last_5 = sma60[-5:]

# 各移動平均の連続上昇の確認
is_short_ma_rising = all(x < y for x, y in zip(short_ma_last_5, short_ma_last_5[1:]))
is_mid_ma_rising = all(x < y for x, y in zip(mid_ma_last_5, mid_ma_last_5[1:]))
is_long_ma_rising = all(x < y for x, y in zip(long_ma_last_5, long_ma_last_5[1:]))

# トレンド分析
if is_short_ma_rising and is_mid_ma_rising and is_long_ma_rising:
    print("強い上昇トレンド")
elif is_short_ma_rising:
    print("短期の上昇トレンド")
elif is_long_ma_rising:
    print("長期の上昇トレンド")
else:
    print("トレンドは不明確です")
この例は、過去5日間の短期、中期、長期の移動平均を比較して市場トレンドを分析します。
- 各移動平均が連続して上昇するかを確認することで、上昇トレンドが特定されます。短期、中期、長期の移動平均がすべて上昇している場合は強い上昇トレンドとみなされ、短期のみが上昇している場合は短期の上昇トレンド、長期のみが上昇している場合は長期の上昇トレンドとされます。
- 下降トレンドの場合、各移動平均が連続して下降する場合にトレンドが判断されます。短期、中期、長期の移動平均のうちどれが下降しているかに応じて、トレンドのカテゴリがさらに詳細化されます。
- トレンドがはっきりしない場合、つまり短期、中期、長期の移動平均の一部しか上昇または下降していない場合、さらなる分析が必要となる場合があります。
この方法は、各移動平均の変動を考慮することで、全体の市場状況を理解し、上昇および下降トレンドを正確に分析および区分する利点を提供します。異なる期間や移動平均指標を使用することで、より洗練された分析が可能であり、投資戦略において柔軟に適用することができます。
TA-Libを使用したゴールデンクロスとデッドクロスの分析
ゴールデンクロス
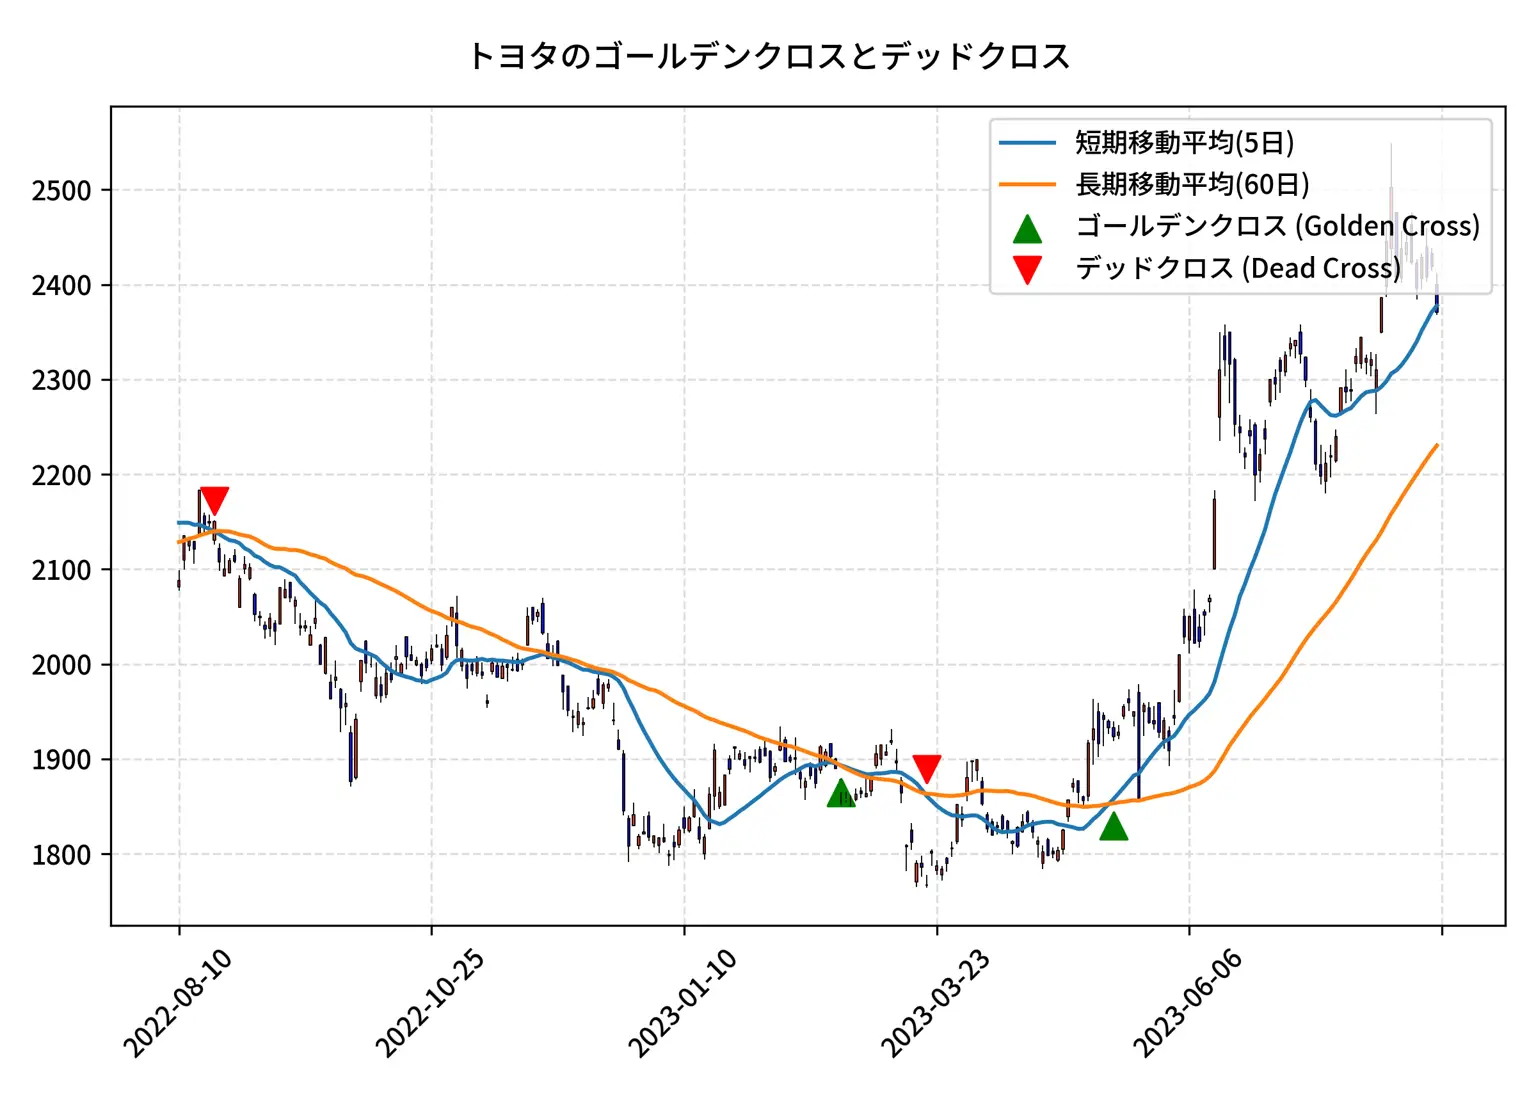
ゴールデンクロスは、短期移動平均線が長期移動平均線を上回る場合に発生します。以下のコードは、ゴールデンクロスを見つける方法を示しています。
short_sma = talib.SMA(close_prices, timeperiod=20)
long_sma = talib.SMA(close_prices, timeperiod=60)

# ゴールデンクロスの発見
for i in range(1, len(close_prices)):
    if short_sma[i] > long_sma[i] and short_sma[i-1] <= long_sma[i-1]:
        print(f"ゴールデンクロスを特定: 日 {i}")
デッドクロス
デッドクロスは、短期移動平均線が長期移動平均線を下回る場合に発生します。以下のコードは、デッドクロスを見つける一例です。
# デッドクロスの発見
for i in range(1, len(close_prices)):
    if short_sma[i] < long_sma[i] and short_sma[i-1] >= long_sma[i-1]:
        print(f"デッドクロスを特定: 日 {i}")
移動平均とTA-Libを利用した市場分析は、投資家にとって重要な情報を提供することができます。単純な移動平均から、ゴールデンクロスやデッドクロスなどの複雑な指標に至るまで、さまざまな方法で市場のトレンドと変動を分析することができます。この洞察は、投資戦略の計画と実施をより正確に行い、微細な市場の動きを理解するのに役立ちます。
よくある質問
- TA-Libのインストール方法は?
- TA-Libのインストールにはいくつかの方法があります。詳細な手順は[TA-Lib] #2: 技術的分析のためのTA-Libインストールで見ることができます。
- 移動平均以外にTA-Libで計算できる他の指標は?
- TA-Libはボリンジャーバンド、RSI、MACDなど、150以上のテクニカル指標を提供しています。今後のこのシリーズでこれらの他の指標について詳しく取り上げる予定です。
- ゴールデンクロスまたはデッドクロスがいつ発生するかをどうやって知ることができますか?
- ゴールデンクロスとデッドクロスは、それぞれ短期移動平均線が長期移動平均線の上または下に交差する場合に発生します。提供されたコード例を使用して、これらのシグナルを特定することができます。
- 初心者の投資家にとって有用な他のテクニカル指標は?
- 初心者の投資家にとって、RSI(相対強弱指数)、MACD(移動平均収束発散)、ボリンジャーバンドなどの指標が価値があるかもしれません。これらの指標は、価格の相対強さと変動性を測定するので、移動平均と併用することで市場のさまざまな側面を分析するのに役立ちます。
- 移動平均線分析のみを使用する限界はありますか? それを他の分析方法とどのように組み合わせるべきか?
- 移動平均線は一般的な市場のトレンドを識別するのに役立ちますが、複雑な市場状況や特定のイベントを分析する際の制限があるかもしれません。それらを根本分析、他のテクニカル指標、経済指標などと補完することが望ましいでしょう。さまざまな分析方法の組み合わせにより、市場の多面的な側面のより正確な理解と予測が可能になります。
シリーズ / TA-Lib カテゴリーの他の投稿

CloneCoding
1行のコードから始まる革新!
Categories
- Language(43)
- Web(17)
- シリーズ(7)
- Tips & Tutorial(4)
Recent Posts
![[JavaScript] html2canvasを使用してウェブページのスクリーンショットをダウンロードする方法]() html2canvasライブラリを使用してウェブページのスクリーンショットをダウンロードする方法を学ぶ。html2canvasの特長や利点、インストール方法、使用方法、注意点についても詳しく解説。
html2canvasライブラリを使用してウェブページのスクリーンショットをダウンロードする方法を学ぶ。html2canvasの特長や利点、インストール方法、使用方法、注意点についても詳しく解説。![[CSS] ダークモードの実装方法 - システム設定ベースとユーザー選択ベースのモード変更]() ウェブページにダークモードを実装する方法について解説します。システム設定をベースにダークモードを実装する方法や、ユーザーの選択をベースにダークモードを実装する方法を学びましょう。
ウェブページにダークモードを実装する方法について解説します。システム設定をベースにダークモードを実装する方法や、ユーザーの選択をベースにダークモードを実装する方法を学びましょう。![[Next.js] SSR、SSG、CSRを使用するのはいつか - 適切な利用ケースを探る]() Next.jsで、SSR、SSG、CSRのどのレンダリング方法がどのサイトカテゴリに最も適しているかを詳しく説明します。
Next.jsで、SSR、SSG、CSRのどのレンダリング方法がどのサイトカテゴリに最も適しているかを詳しく説明します。![[CSS] 仮想セレクタ(Pseudo selector) 完全ガイド - 知っておくべきスタイリング技術]() CSSの仮想セレクタ(Pseudo selector)について詳しく説明します。:first-child、:last-child、:nth-child(n)などを学び、実践的な利用例を探します。
CSSの仮想セレクタ(Pseudo selector)について詳しく説明します。:first-child、:last-child、:nth-child(n)などを学び、実践的な利用例を探します。![[Next.js] 3つのレンダリング方法 - SSR、CSR、SSG:長所と短所の分析]() Next.jsの3つのレンダリング方法、すなわちサーバーサイドレンダリング(SSR)、クライアントサイドレンダリング(CSR)、および静的サイト生成(SSG)に関する動作、長所、短所を深く探る。
Next.jsの3つのレンダリング方法、すなわちサーバーサイドレンダリング(SSR)、クライアントサイドレンダリング(CSR)、および静的サイト生成(SSG)に関する動作、長所、短所を深く探る。

![[JavaScript] html2canvasを使用してウェブページのスクリーンショットをダウンロードする方法](https://img.clonecoding.com/thumb/101/16x9/320/javascript-html2canvasを使用してウェブページのスクリーンショットをダウンロードする方法.webp)
![[CSS] ダークモードの実装方法 - システム設定ベースとユーザー選択ベースのモード変更](https://img.clonecoding.com/thumb/100/16x9/320/css-ダークモードの実装方法-システム設定ベースとユーザー選択ベースのモード変更.webp)
![[Next.js] SSR、SSG、CSRを使用するのはいつか - 適切な利用ケースを探る](https://img.clonecoding.com/thumb/99/16x9/320/next-js-ssr-ssg-csrを使用するのはいつか-適切な利用ケースを探る.webp)
![[CSS] 仮想セレクタ(Pseudo selector) 完全ガイド - 知っておくべきスタイリング技術](https://img.clonecoding.com/thumb/98/16x9/320/css-仮想セレクタ-pseudo-selector-完全ガイド-知っておくべきスタイリング技術.webp)
![[Next.js] 3つのレンダリング方法 - SSR、CSR、SSG:長所と短所の分析](https://img.clonecoding.com/thumb/97/16x9/320/next-js-3つのレンダリング方法-ssr-csr-ssg-長所と短所の分析.webp)